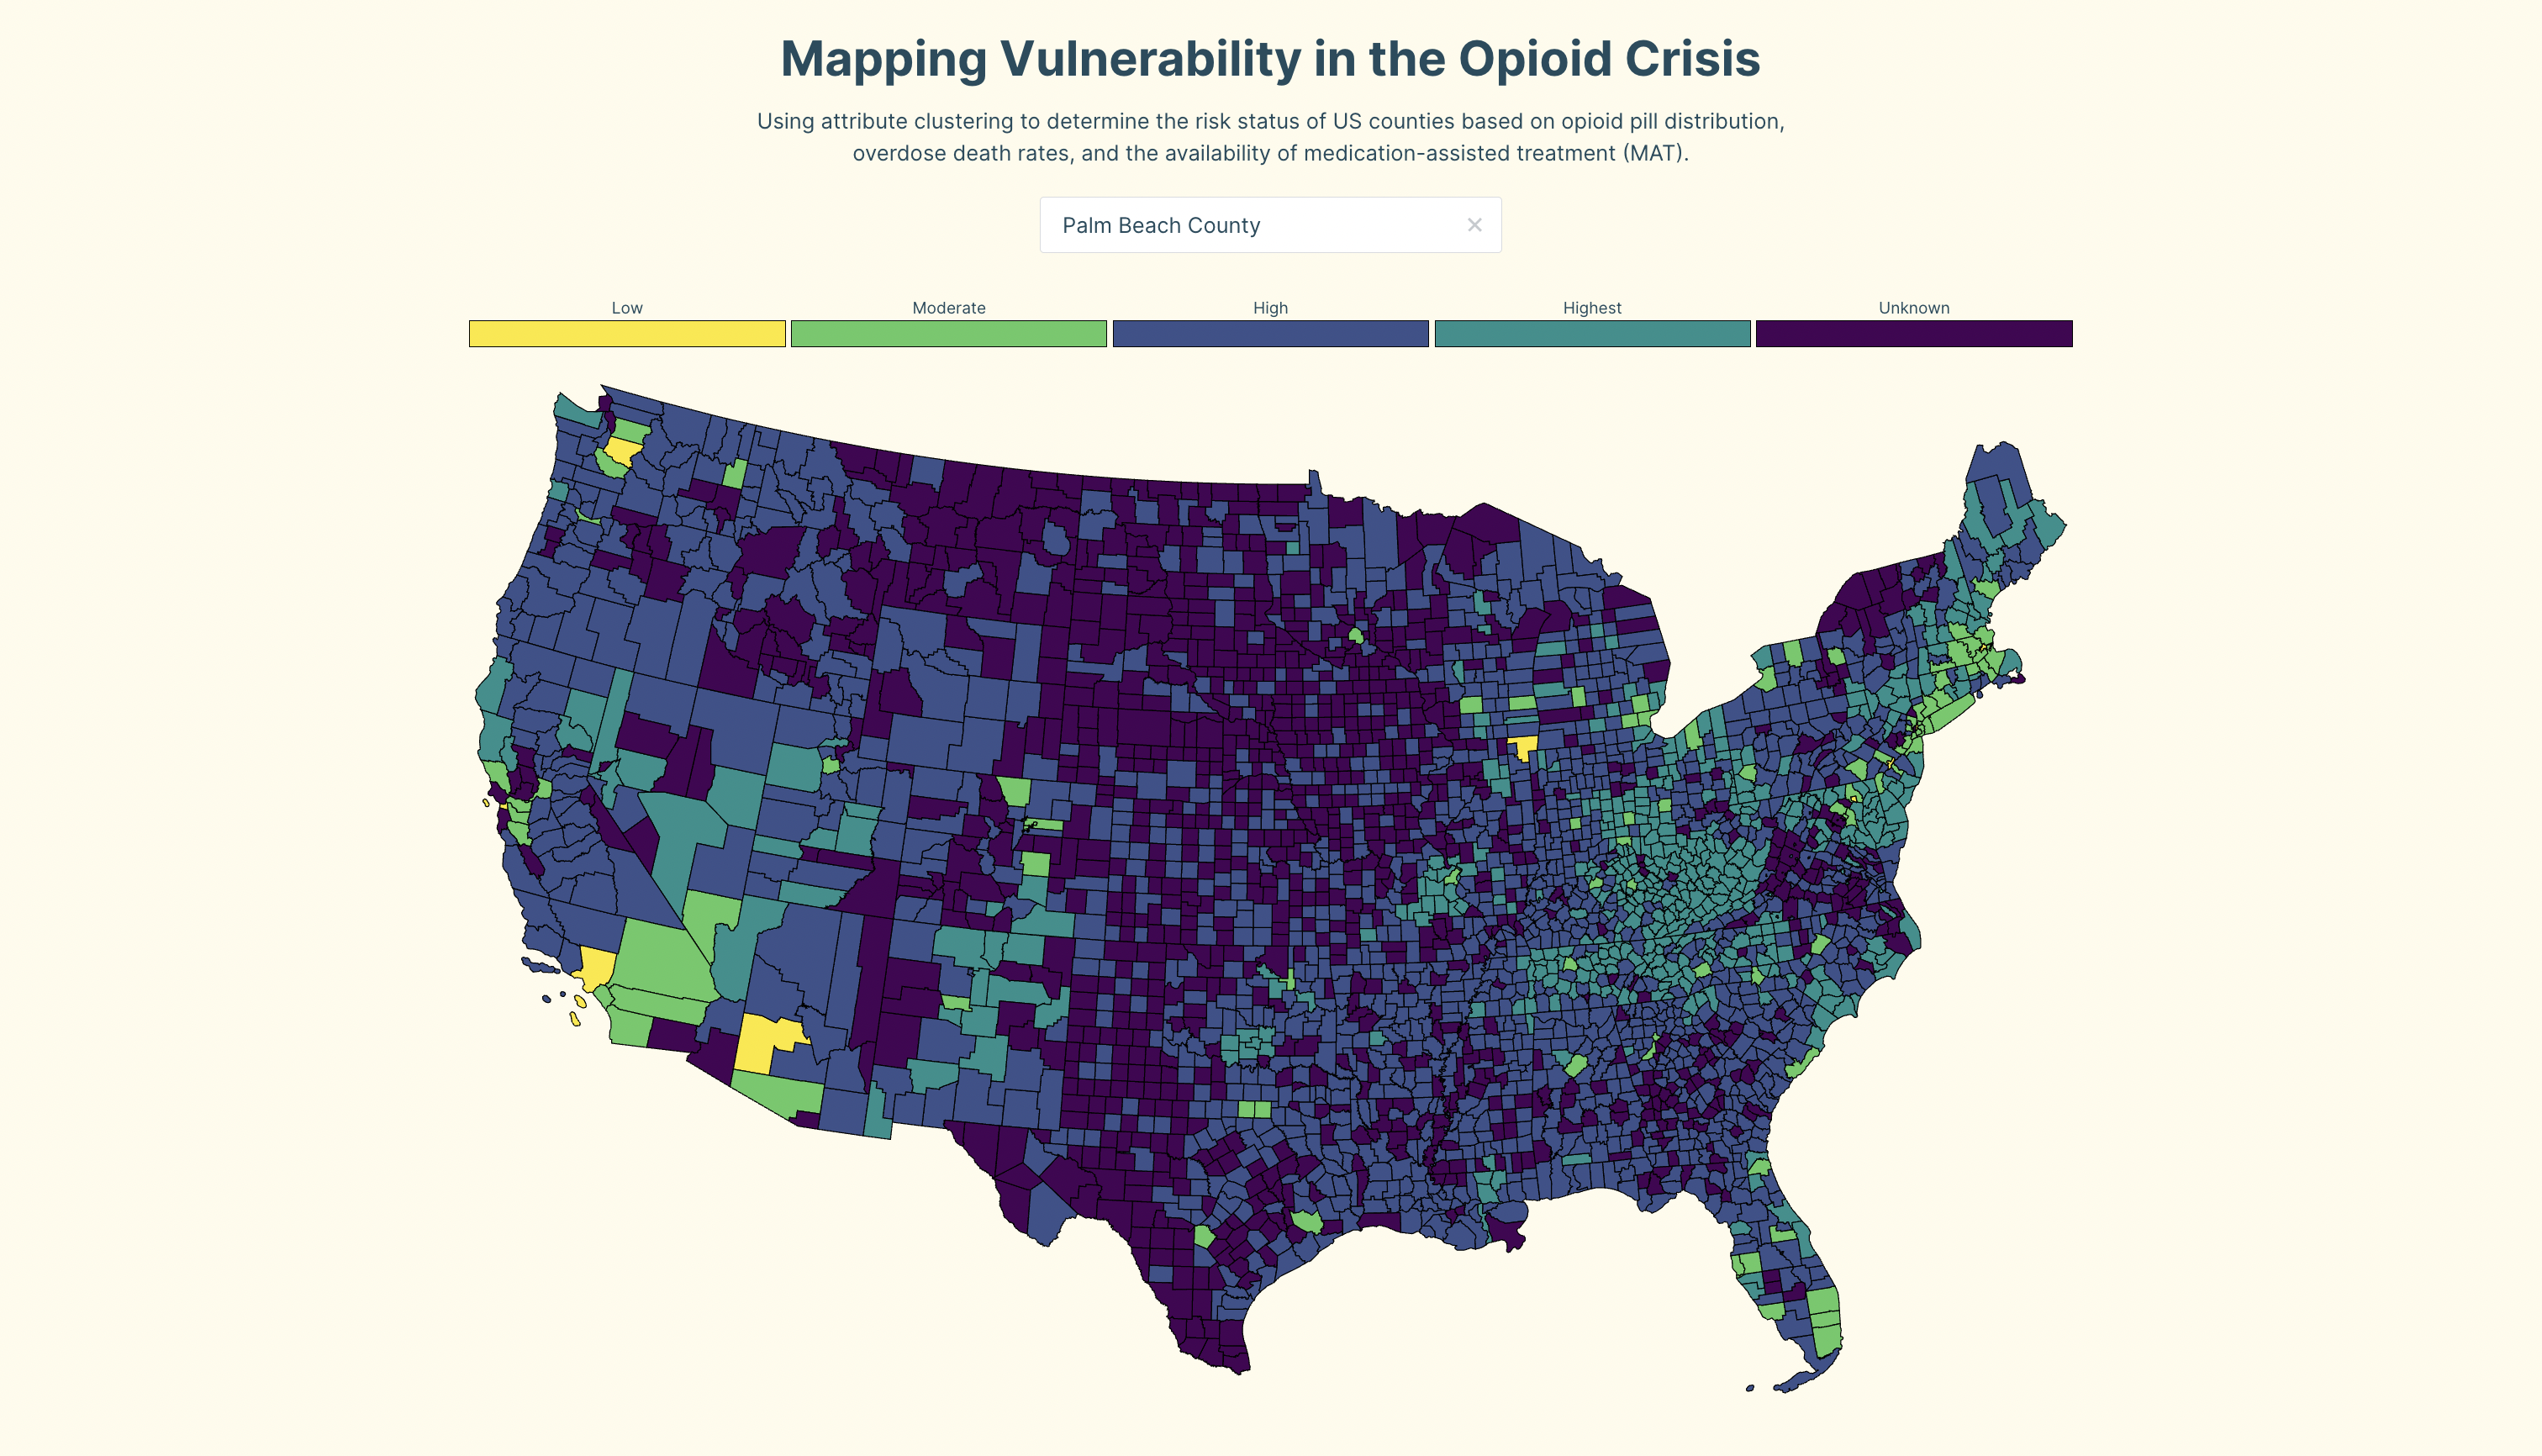
Mapping Vulnerability in the Opioid Crisis
Attribute clustering was utilized to analyze three key variables identified as crucial factors in
the ongoing opioid epidemic: overdose deaths per 100,000 people (2010-2020), opioid pills prescribed
per 100 people (2012), and MAT (Medication-Assisted Treatment) providers (2022). These variables
were processed through a KMeans algorithm, generating five clusters to assess risk levels in
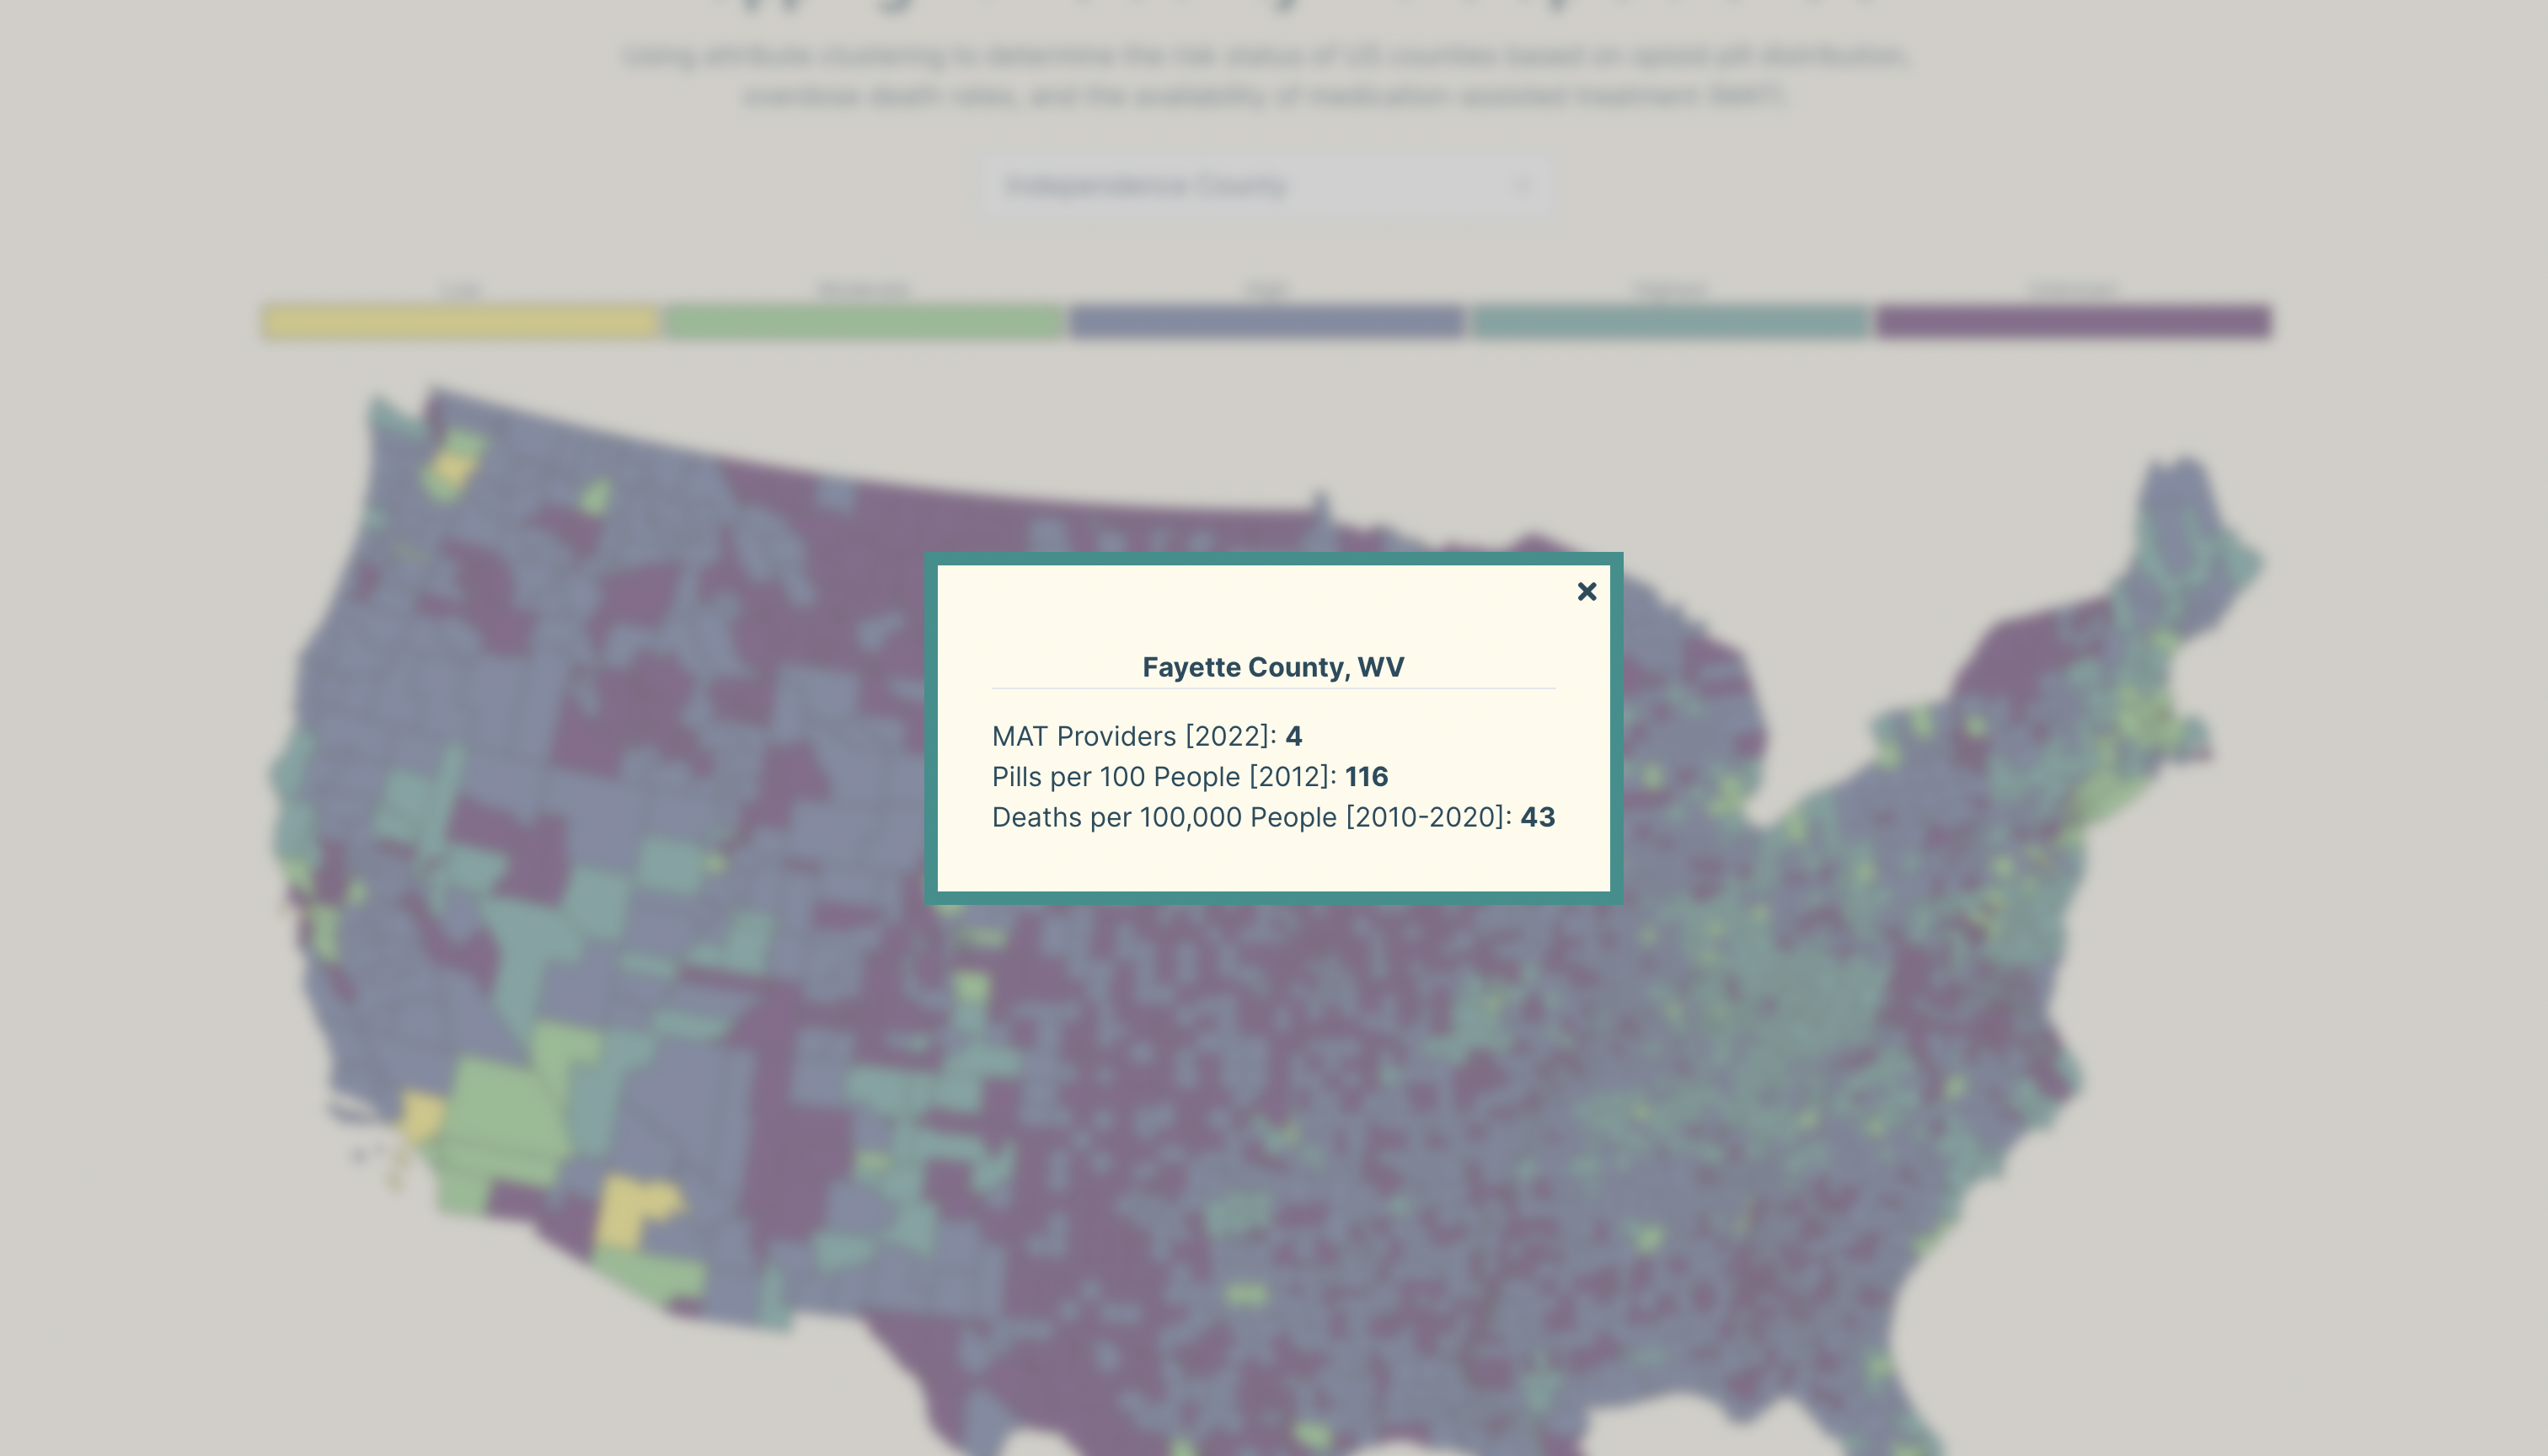
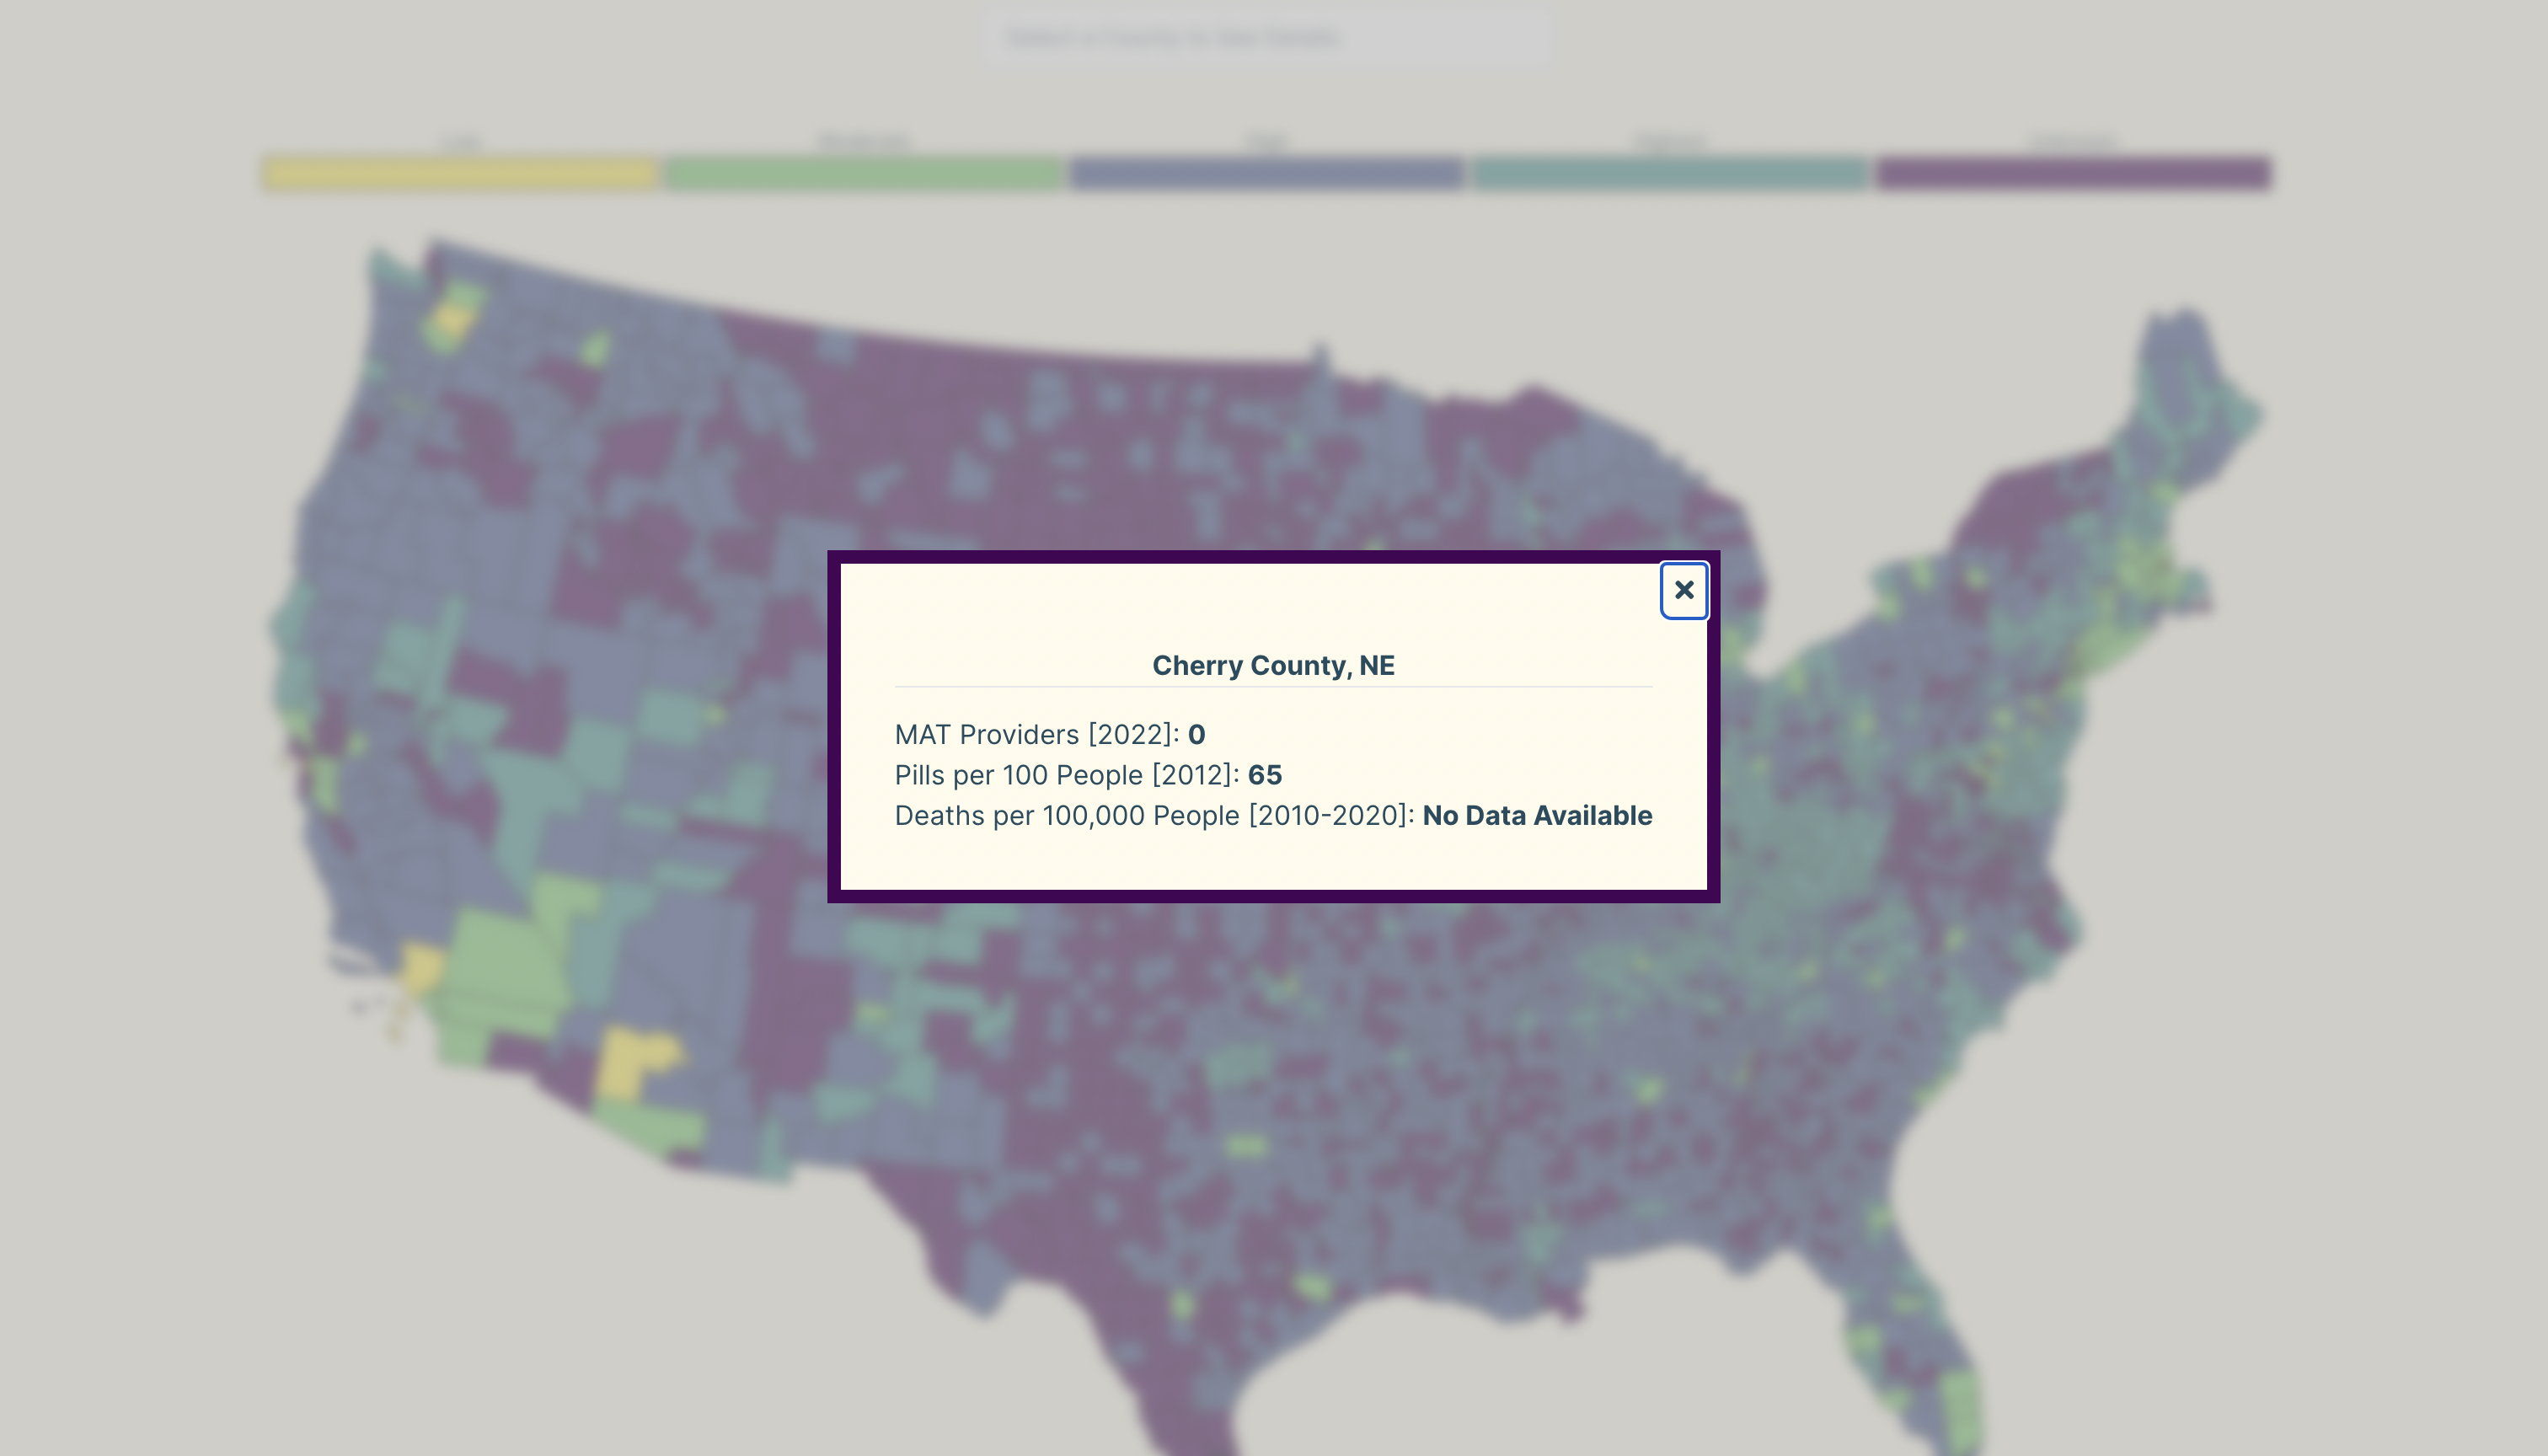
counties. Each cluster is depicted by a distinct color in the choropleth map, providing insight into
the underlying data by clicking on individual counties or using the search function.
* A
further explanation of the methodology can be found in the link below.
What I Used
- Svelte
- D3.js
- Tailwind
- Qgis
- GeoDa
- Data Sources: CDC, amfAR, SAMHSA, and The Washington Post Pill Database